As we've shared with you previously, sales of hybrids and electric vehicles are on the rise and more automakers are adding electrified models into their lineups. But when it comes to where demand for electrified vehicles is skyrocketing the most, the answer may surprise you.
For the data we turn to iSeeCars which analyzed the U.S. regions with the biggest shift in market share for alternative fuel vehicles since 2014. The results? The fastest-growth areas aren't big densely-populated cities on the coast. And the states with the highest growth in market share since 2014 will probably surprise you too. Mississippi. Hawaii and Utah are the top three on the list.
Top 15 States and Cities With Highest Growth Rate in Hybrid/EVs
Here are the top 15 states with the highest growth rate in hybrid and electric vehicle market share according to iSeeCars.com.
|
U.S. States with Highest Growth in Hybrid/Electric Vehicle Share -- iSeeCars Study |
||||
|
Rank |
State |
Alternative Fuel Vehicle share 2014 |
Alternative Fuel Vehicle share 2022 |
Change in Alternative Fuel Share |
|
1 |
Mississippi |
0.9% |
3.1% |
240.9% |
|
2 |
Hawaii |
2.4% |
5.2% |
116.5% |
|
3 |
Utah |
2.3% |
4.5% |
97.0% |
|
4 |
Maryland |
2.2% |
4.0% |
84.3% |
|
5 |
Wyoming |
1.0% |
1.7% |
79.1% |
|
6 |
Nevada |
2.4% |
4.4% |
78.8% |
|
7 |
Texas |
1.6% |
2.9% |
76.9% |
|
8 |
Colorado |
2.3% |
4.0% |
75.6% |
|
9 |
California |
4.8% |
8.3% |
75.2% |
|
10 |
Michigan |
1.2% |
2.0% |
71.6% |
|
11 |
Arizona |
2.9% |
5.0% |
71.6% |
|
12 |
Minnesota |
1.7% |
2.9% |
70.2% |
|
13 |
Ohio |
1.4% |
2.4% |
67.1% |
|
14 |
Washington |
3.8% |
6.3% |
65.9% |
|
15 |
Nebraska |
1.5% |
2.5% |
65.3% |
|
National Average |
2.2% |
3.4% |
54.1% |
|
When it comes to cities, Houston tops the list, followed by Salt Lake City and Detroit. We've denoted Car Pro Show radio markets in blue.
| U.S. Cities with Highest Growth in Hybrid/Electric Vehicle Share -- iSeeCars Study | ||||
| Rank | City | Alternative Fuel Vehicle share 2014 | Alternative Fuel Vehicle share 2022 | Change in Alternative Fuel Share |
| 1 | Houston, TX | 1.4% | 3.3% | 130.4% |
| 2 | Salt Lake City, UT | 2.2% | 4.4% | 105.3% |
| 3 | Detroit, MI | 1.1% | 2.2% | 99.7% |
| 4 | Sacramento, CA | 3.7% | 7.4% | 98.8% |
| 5 | Dallas-FT Worth, TX | 1.8% | 3.6% | 98.5% |
| 6 | Grand Rapids, MI | 1.5% | 2.9% | 95.0% |
| 7 | Birmingham, AL | 1.3% | 2.5% | 88.0% |
| 8 | Cleveland-Akron, OH | 1.2% | 2.2% | 86.5% |
| 9 | San Francisco, CA | 6.5% | 12.1% | 86.2% |
| 10 | Las Vegas, NV | 2.5% | 4.6% | 81.3% |
| 11 | Minneapolis, MN | 1.7% | 3.0% | 78.8% |
| 12 | Phoenix, AZ | 3.0% | 5.2% | 77.7% |
| 13 | Denver, CO | 2.3% | 4.1% | 77.1% |
| 14 | Baltimore, MD | 2.3% | 3.9% | 74.8% |
| 15 | Columbus, OH | 1.7% | 3.0% | 73.0% |
| National Average | 2.2% | 3.4% | 54.1% | |
To see a the complete iSeeCars analysis and commentary visit iSeeCars.com.
Interested in a Hybrid or an EV?
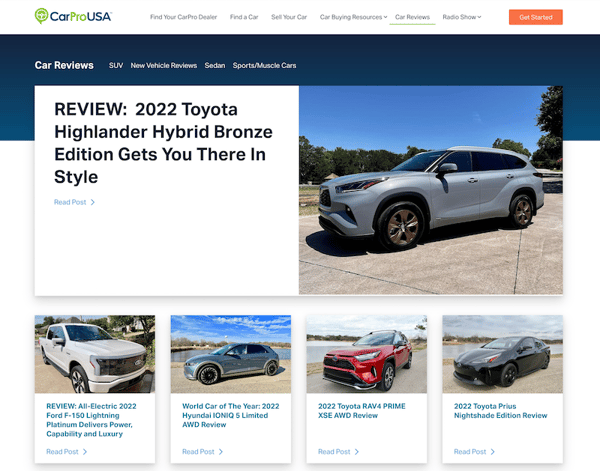
Check out our Hybrid/Electric review section by clicking here or on the photo below.

